Data Visualization

Make Your Data Easier to Understand and Act On

Your business generates data across marketing, sales, customer interactions, and operations. But when that information is scattered across spreadsheets and disconnected reports, finding the insights that matter takes time.

BonMinds helps you turn business data into clear dashboards, visual reports, and meaningful performance views. We focus on presenting the right information in a way that helps decision-makers spot trends, understand results, and decide what to do next.

200+
Shopify Projects Delivered Across 20+ countries
2x – 5x
Average Revenue Growth Achieved by our clients
35%+
Conversion Improvement On average
10+
Years of Ecommerce Expertise Building brands that scale
“BonMinds understood our business inside out and built a Shopify store that truly drives results.”
— Sarah MitchellFounder, Purely Yours

The Reporting Challenge

Your Data Is Available, but the Answers Are Not Always Clear

Collecting data is only part of the job. Your team also needs to understand what it means, see how different metrics relate, and find the information required to make decisions without manually piecing together reports.

  • Reports Take Too Long to Interpret

    Spreadsheets filled with numbers and lengthy reports make it difficult to identify important changes quickly. Your team spends time reading data instead of acting on it.

  • Metrics Are Scattered Across Platforms

    Marketing, sales, and operational information often live in separate tools. Without a clear way to bring relevant metrics together, understanding overall performance becomes harder.

  • Important Trends Get Overlooked

    Changes in performance, unusual patterns, and relationships between metrics can be difficult to spot when data is presented without useful visual context.

  • Teams Lack a Shared View of Performance

    Different teams may rely on different reports or definitions of success. Inconsistent views make it harder to align priorities and discuss results using the same information.

What We Deliver

Data Visualization Built Around Your Business

We design data visualizations around the questions your team needs to answer. Each deliverable focuses on making relevant information easier to find, interpret, and use.

  • Business Performance Dashboards

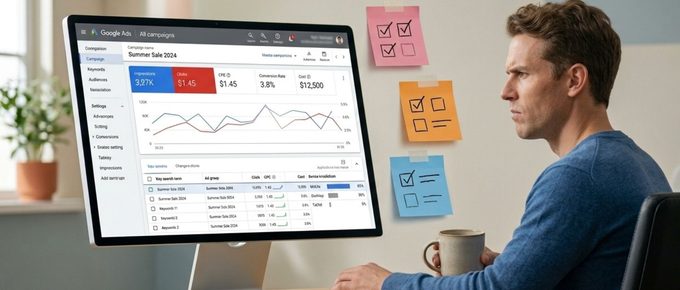
    Bring important business metrics into a structured visual view. We organize relevant indicators so decision-makers can review performance without navigating multiple disconnected reports.

  • Marketing and Campaign Visualizations

    Present campaign metrics, channel performance, and marketing trends in a format that helps your team understand what is working and where further investigation may be needed.

  • Custom Reports and Charts

    Translate complex datasets into appropriate charts, graphs, and visual summaries. We select formats based on the information being communicated and the decisions the report needs to support.

  • Data Structuring and Metric Selection

    Identify the metrics, comparisons, and breakdowns that matter to your objectives. We help organize the information so visualizations remain relevant, readable, and focused.

  • Visualization Refinement

    Review existing dashboards and reports to identify clutter, unclear comparisons, and opportunities to improve information hierarchy, consistency, and readability.

Our Approach

From Business Questions to Clear Visual Insights

The engagement starts with the decisions you need to make, not with a chart template. Each stage helps ensure the final visualizations serve a practical business purpose.

  • We examine the available data sources, existing reports, metric definitions, and data quality considerations. This helps identify what can be visualized and where preparation or clarification is needed.

    Review Your Data

Connected Expertise

Visualization Works Better with the Right Analytics Foundation

A useful dashboard depends on more than its visual design. Metric definitions, data quality, tracking, and business context all influence whether a visualization tells the right story. BonMinds brings development, growth marketing, and conversion and analytics expertise together to support a more complete reporting solution.

A Connected View of Performance

From collecting meaningful metrics to presenting them clearly, we consider how your visualizations fit into the wider process of measuring performance and making decisions.

  • Digital Analytics
  • Marketing Attribution
  • Business Intelligence
  • Data Preparation
  • Dashboard Development
  • Conversion Optimization

When It Makes Sense

Is Data Visualization Right for Your Business?

  • Marketing Teams

    You Need a Clearer View of Campaign Performance

    You want to understand how campaigns and channels are performing without manually combining reports from multiple marketing platforms.

  • Business Leaders

    You Need Faster Access to Key Metrics

    You need a consolidated view of important business indicators to support planning, performance reviews, and conversations about priorities.

  • Growing Businesses

    Your Reporting Has Become Difficult to Manage

    Your business has added tools, channels, and data sources, leaving your team with fragmented reporting and increasingly complex spreadsheets.

  • Analytics Teams

    Your Existing Dashboards Need Improvement

    You already collect data but need clearer visual hierarchies, more meaningful comparisons, and reports that stakeholders can interpret confidently.

Reporting That Supports Better Decisions

Effective data visualization connects the numbers you collect with the questions your business needs to answer. Our focus is on making that connection clear, practical, and relevant to your team.

“Their deep knowledge of the platform is a definite plus, allowing them to make changes or add features easily. They drastically increased our store's load speed, cleaned up the code, and fixed existing bugs.”
JM

Julien Méthot

Founder at Nordik

Let's connect. Talk to the BonMinds team.

Write us a line. We answer in hours, not days. From a real person on the team, never an SDR. No discovery call required to start a conversation.

Replies in hours · No pitch deck · No B.S.